
Pie chart is a circular graphic that is divided into slices to illustrate numerical proportions. Pie charts work best when the data points are simple, and comparisons between different percentages are dramatic (i.e., you are trying to compare parts of a whole — x% out of 100%).
Here are essential recommendations for designing effective pie charts.
Before creating a pie chart
Designers tend to use pie charts because they’re familiar with this chart type, but sometimes, a pie chart isn’t the best choice. For example, if you want to compare proportions, a stacked bar chart might work best for this task. It’s important to think about the story you’re trying to tell with the data and choose the visualization that communicates that story most effectively.
Avoid using a pie chart when:
- Data is not parts of a whole. If the data you’re presenting isn’t naturally part of a whole (i.e., it doesn’t add up to 100%), a pie chart is not appropriate.
- Precise data comparisons needed. Pie charts are not ideal when you need to compare data points with high precision. The size of the slices can make it hard to see small differences.
- Showing data over time. Pie charts are static and don’t effectively represent changes over time. Use a line chart or an area chart to show trends over time.
- Comparing multiple data sets. Pie charts are not effective for comparing more than one dataset at a time, as they are designed to show only one whole. Use grouped bar charts, multiple line charts, or a treemap to compare multiple datasets.
Data categories
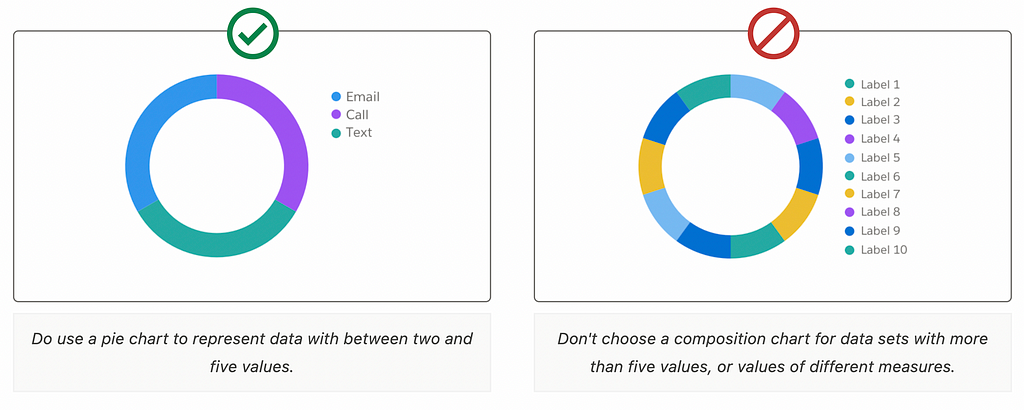
Use 5 or fewer discrete categories that add up to 100%
Limit the number of slices to 5–7 to avoid clutter and make the chart easier to read. If you have more data points, consider grouping smaller slices into an “Other” category.
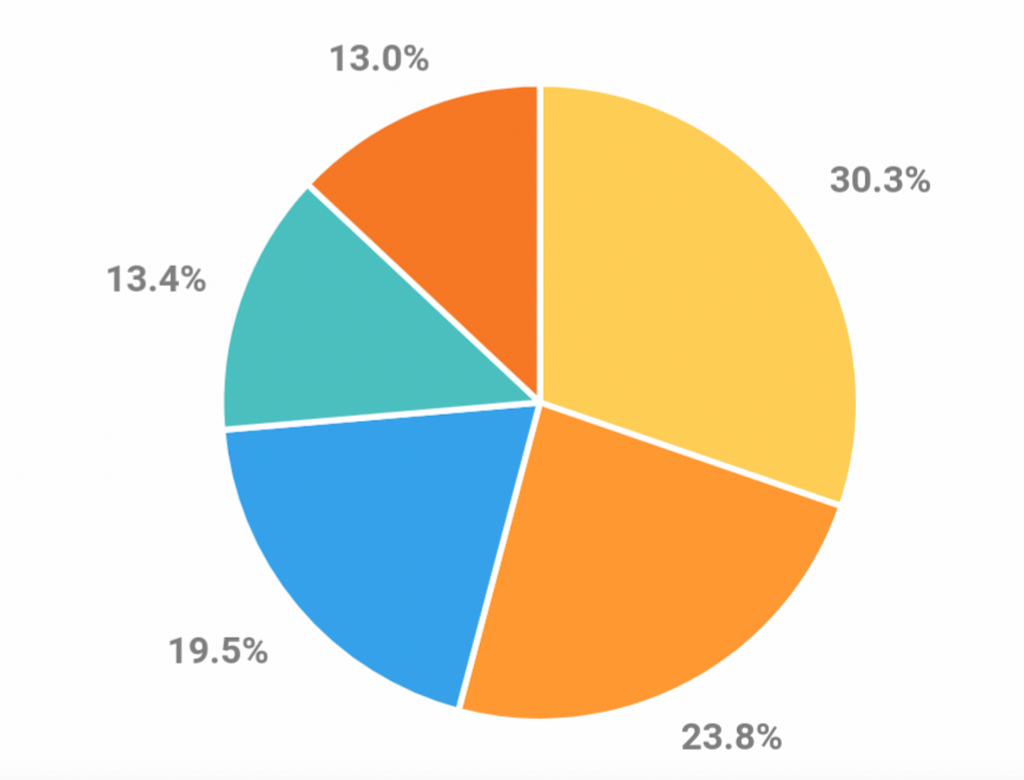
Try to avoid using a pie chart when the distinctions between data points aren’t large (24%, 25%, 25%, 26%, for example).
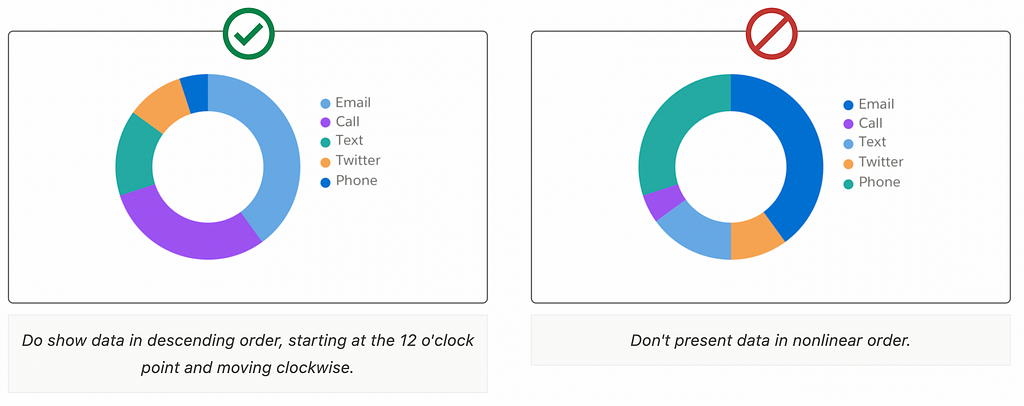
Linear data order
Make it easier for people to scan data by ordering it in descending order, starting at the 12 o’clock point and moving clockwise.
Colors
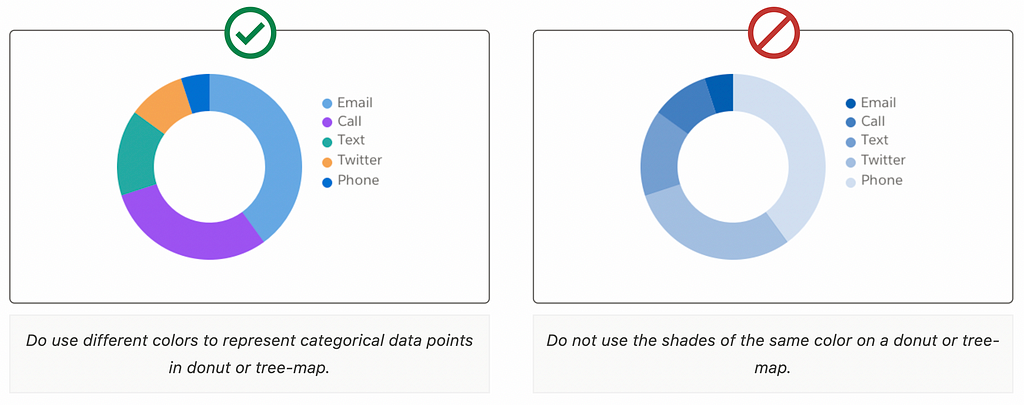
Use contrasting colors to differentiate between pieces of data
Make it easier for users to distinguish different categories using contrasting colors. Ensure the colors you choose to use are distinguishable by users with color vision deficiencies.
Visual styling
Divider lines
A divider line that separates any touching colors helps to differentiate categories. Use a 1px stroke between sections of the pie if it helps add visual clarity, especially if you’re using colors from the same spectrum.
Stick to 2D designs
3D pie chart might look impressive in UI mocks, but as soon as users start using your product, they will hate your design. 3D can distort the perception of the slice sizes and make the chart harder to read.

Interaction design
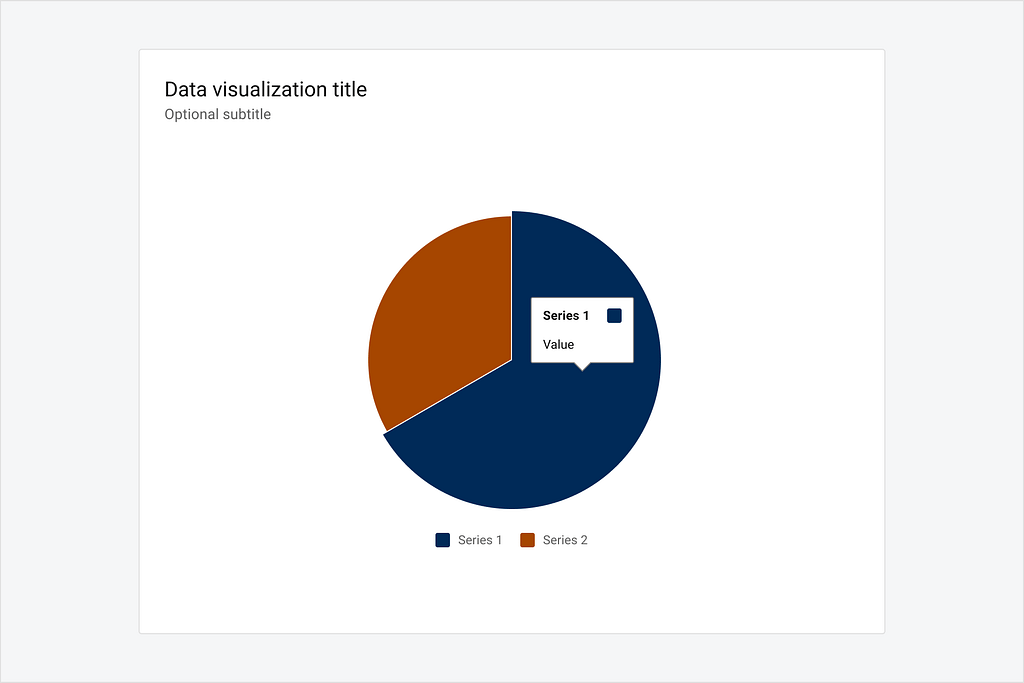
Support mouse hover / tap on a slice
Make it easier for users to extract additional information from the pie chart by supporting the hover effect. Hovering or tapping a slice should add a focus to the selected slice and trigger a tooltip containing that slice’s data (such as slice value).
Want to master your UI design skills?
Whether you’ve been working as a designer for years or are completely new to design, Designlab has programs and courses to help you take the next step in your design career (even if that’s your first step).
Online UI and UX Design Courses and Bootcamps | Designlab
This post contains affiliate link(s)
![]()
Pie Chart UI Design Tips & Tricks was originally published in UX Planet on Medium, where people are continuing the conversation by highlighting and responding to this story.