
TL;DR: To get higher quality results from your UX research studies, apply these tried and tested measures: 1) Set clear expectations, 2) catch cheaters through automatic and manual controls, 3) add crafty questions, 4) guide participants, 5) record the screen, 6) analyse study metrics, 7) spot satisficing behaviour, and 8) inspect open-ended question responses.
Running research online can often feel like a balancing act. You spend time crafting questions and tasks with an outcome in mind but have to be careful to not bias participants to say what you or people in the business hope to hear. You want participants to mindfully answer your questions but also don’t want to ask for too much. You aim to learn how participants solve tasks independently but you also want to offer the right level of guidance.
One of the questions I get asked most often as a UX research advisor is “How can I get better quality results from my studies?” This often comes from a situation where studies yield lots of useful insights but also those answers that seem somewhat … random, or at least unhelpful. This can not only feel quite frustrating for the researcher but also lead to costly repeated work and extended research timelines due to fixing efforts.
To tackle this, I advise to apply measures from the areas of study design optimisation and data cleaning after they’ve completed. In this article, I’m explaining these specific steps with examples, so do keep in mind that this is not about general UX research study best practices but about the additional things to do to get a higher quality outcome from your studies.
Study optimisation — Before you launch
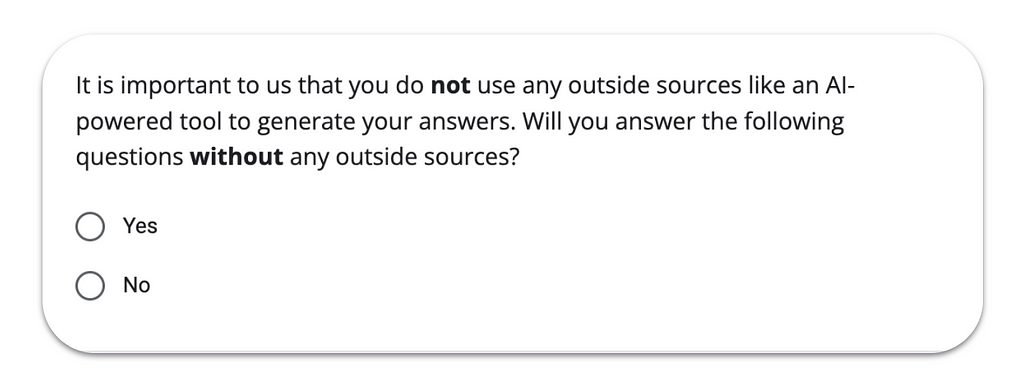
The first thing to take care of in your study is to set the right expectations with participants and, if you want to go one step further, ask them for the commitment you seek. Like so often in communication, if we don’t share what we want, people won’t be able to act accordingly, so don’t skip this part even if it might feel a bit obvious. Studies show that when humans actively commit to a specific positive action (e.g., clicking “Yes” in the example below), they are more likely to actually do what they said.
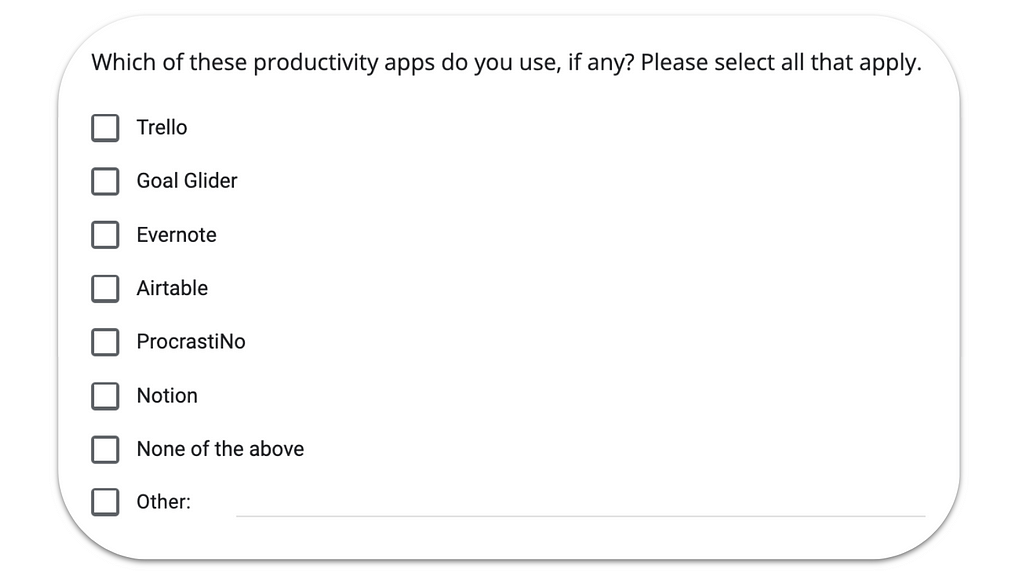
You might want to consider adding “Pay attention” or “Red herring” tasks as well — very easy-to-answer questions with one or more illogical or nonexistent answer options — to be able to spot cheaters in your results later on. The name comes from the intention to use certain questions to quickly “catch” respondents who don’t read the question properly, randomly select one or all of the options, or don’t come with the desired background knowledge to take part. Despite the utility for enhancing the quality of your study results, be aware that an excessive use can be perceived as condescending or distracting so do use them selectively.
Following those measures that usually sit more at the beginning of a study, another simple way to reach higher quality study results is to include appropriate guidance throughout. If participants don’t know how many tasks to expect, where they currently are, and how much they still need to go through, they can get lost, overwhelmed, and frustrated. This is one of the big reasons why response quality suffers as disoriented participants “just want to get it over with.” To avoid this, consider these three options: 1. Clearly stating the expected workload on your welcome page (number of tasks, time it will take, etc.), 2. Adding a progress bar if available in your tool of choice, 3. Adding text-only blocks at appropriate spots throughout the study, e.g. when 50% are done (“You’re halfway through! Only x more tasks to go.”) and shortly before the study is done (“Thank you for your input so far. We only have one last question.”) This will help participants spread their concentration and energy equally across the study.
Some of the platforms for running remote research offer built-in controls to spot cheaters based on technical considerations like time spent or clicks made in a task. They can be useful if there’s a defined minimum below which it’s simply impossible to complete a task correctly. An example could be to ask participants to thoroughly read the text on a web page. If you know there are 600 words and it takes about three minutes to read all of it, you could exclude anyone spending less time on the task. I always put a warning sign on such controls though as they are very static and don’t account for subtleties in user behaviour that can be relevant to the research. It doesn’t always do justice to the way humans solve tasks to reduce it to high-level metrics. Think about these scenarios:
- An elderly user struggles with the small fonts on the page and stops the task after twenty seconds to avoid a headache.
- A user finds a shortcut in a task that you weren’t aware of and used less than the defined minimum clicks.
These can yield highly relevant user insights and even potential areas for product improvement, but if you set up automatic exclusions, you would never even get to see them. Therefore, use automatic cheater controls very carefully and when in doubt, be rather generous with your definitions.
In any study, whether it’s mainly qualitative or quantitative, don’t forget to add at least one open-ended question to nudge participants to thoroughly formulate an answer. An example could be to ask participants to summarise their experience in a previous task in their own words, or to add a follow-up question such as “What, if anything, would you change about this [website/app/service]?” This can help structure your analysis and also reveal participants that aren’t willing to spend the time and effort needed to give a high quality answer — and you’ll be able to spot them in an instant just by screening the list of answers in your results.
Lastly, if you have access to this function, it can make sense to record the participants’ screen, even if you don’t want to do an in-depth analysis of the observed user behaviour later. One argument for doing so is that similarly to the point above on user commitment, study participants will notice if they are being recorded and the chances of them speeding or cheating through a study will diminish. Recordings also give you the option to dive deeper into specific cases and understand how certain results happened (for example, very long or short completion times).
Data cleaning — After the study is completed
A thoughtful study design is a powerful way to optimise for data quality, but it doesn’t guarantee you’ll have 100% usable and meaningful answers. In fact, analyses show that you can expect around 10% of participants in any online study to cheat. We can and should plan and work with this, for example by recruiting about 10% more participants that we expect to toss from our results later on. Once your study has reached its quota however, it’s time to go on the hunt for responses that need to be cleaned from your precious data set — before starting analysis. As someone who’s run and reviewed hundreds of studies, I recommend the following steps:
- 📊 Start with your task metrics, such as study or task completion time, number of clicks, e.g. in a Click Test, and automatically detected errors, overall number of errors, and “wrong” paths to identify those responses that are outside of an acceptable range from a technical point of view
- 🕵🏻♀️ Note down a participant identifier (e.g. number) if you’re unsure so you can investigate their actual responses before excluding them
- 🦥 Next, look for patterns that indicate satisficing, or taking the easiest path, such as placing all cards into just one category in a Card Sort, or “flat lining” on rating scales (usually picking the middle option on all rating scales)
- 🔎 Now we move on to open-ended responses and look out for those that are unusable (like hit-the-keyboard, asdfghjkl-type answers), not meaningful (such as “Yes”, “No”, “Good” as an answer to a complex open question), or copied and pasted answers across all the questions in the study or from somewhere outside of the study.
The final advice is to not only use the two explained areas study optimisation and data cleaning in conjunction but to also combine the different measures explained within them. One red herring question won’t make sure you’re catching all potential cheaters in a study, just like one “bad” answer doesn’t mean a participant is definitely a cheater.
And that is it! I hope you found these measures and tips to get higher quality results from your research studies useful. If you’ve successfully used any additional ones, feel free to share them in the comments.
Hi, I’m Johanna, a freelance UX advisor based in Barcelona. ☀️ I help teams level up their UX game, manage UX without losing their minds, and build powerful insights systems. I also share my tried and tested resources here. More content is on the horizon so follow me to catch every update!
![]()
How to get higher quality results from your UX research studies was originally published in UX Planet on Medium, where people are continuing the conversation by highlighting and responding to this story.