User engagement metrics measure how actively and effectively users interact with a platform, product, or service. These metrics help businesses evaluate user interest, satisfaction, and retention.
This article explores key user engagement metrics and offers practical tips for improving the metrics.
Number of active users
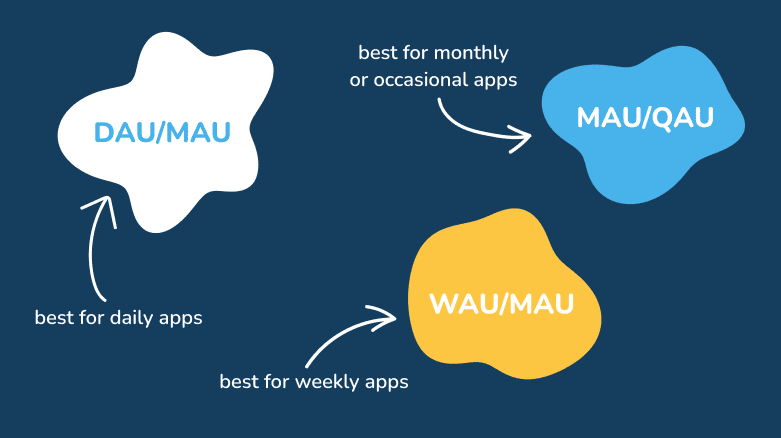
The number of unique users who engage with a product or service in a single day/week/month. This is a versatile metric that works for almost all types of products.
- Daily Active Users (DAU): Number of users who engage with the platform daily. Useful for products with frequent usage (e.g., social media platforms, news, gaming).
- Weekly Active Users (WAU): Users engaged within a week. Ideal for businesses with weekly usage patterns (e.g., e-learning, business tools).
- Monthly Active Users (MAU): Users engaged within a month. Relevant for services with less frequent interaction (e.g., banking).

Benchmarking examples
- Social media (e.g., Facebook, Instagram): High DAU/MAU ratio (~50%) due to daily interactions.
- Streaming services (e.g., Netflix, Spotify): WAU/MAU is higher than DAU/MAU.
- E-Commerce (e.g., Amazon, eBay): MAU is more significant than DAU due to irregular purchasing habits.

Strategies to improve active users
Note that every product is unique, and it is impossible to offer universal recommendations that will work equally well for all product categories. Yet, it’s possible to offer some general recommendations, such as:
- Offer incentives for frequent usage (i.e., coins that users can collect while visiting your platform and redeem them when making order)
- Introduce gamification elements (e.g., leaderboards).
- Identify inactive users and re-engage them with targeted campaigns.
Session length and frequency
Just knowing the number of active users might not be enough to understand user behavior. So its recommended to analyze time and frequency of interaction with a product. Session length tells us how long users stay, while session frequency reveals how often they return.
- Session length: Average time users spend per session. Short sessions (<1 min) → users may have trouble finding what they need or bounce quickly. Medium sessions (1–5 min) → users explore but may not fully engage.

- Session frequency — How often users return. Session frequency varies per product category. Typically, social media and messaging apps have highly engaged users (visit daily/multiple times a day).
- Time on page — The duration a user spends on a specific page.
Strategies to improve session length
- Enhance content relevance: Ensure users find valuable content quickly.
- Improve navigation: Make the interface user-friendly.
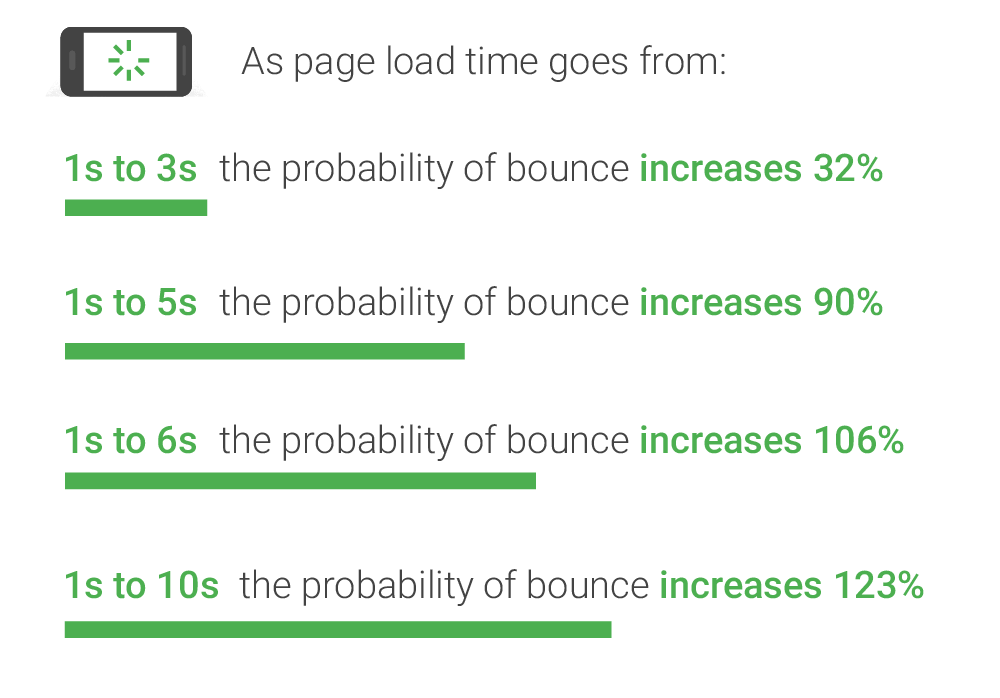
- Optimize loading speed: Faster load times prevent users from leaving.

Strategies to improve session frequency
- Push notifications & emails: Remind users to return.
- Loyalty programs: Reward frequent visits.
- Personalized recommendations: Keep users engaged based on their behavior.

Engagement actions
Last but not least, to get a holistic understanding of user behavior, you need to analyze user actions in your product.
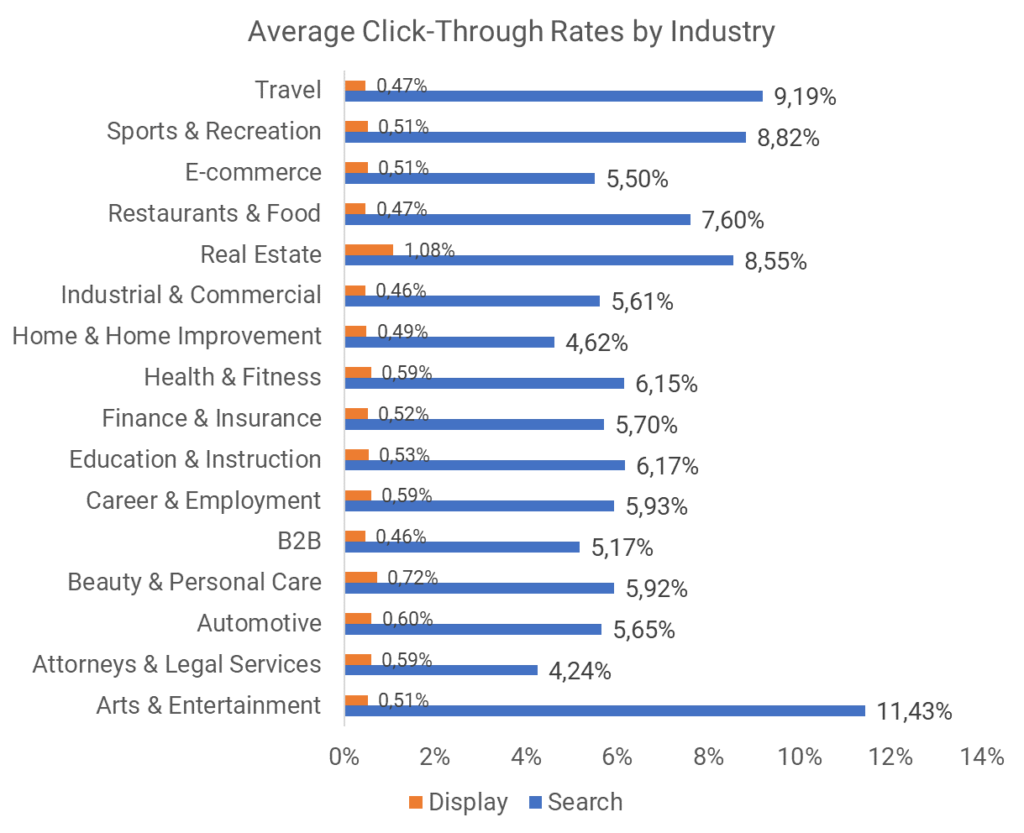
- Click-through rate (CTR): Percentage of users clicking a link/button. It measures effectiveness of call-to-action (CTA) buttons, ads, and email marketing.
- Likes, shares, comments: Interaction levels on social/content platforms. Measures how much users engage with content.
- Pages per session: How many pages users visit per session. This metric indicates content relevance and ease of navigation.

Strategies to improve CTR
- Use Hook framework: Use external (ads, notifications) and internal (emotions, pain points) triggers to drive user action. Then, simplify the action by reducing friction (e.g., one-click sign-ups). Provide variable rewards to keep users engaged. Finally, encourage investment, like saving preferences or contributing content, increasing the likelihood of future engagement.

- Invest in UX writing: Use compelling descriptions and labels for CTAs. One notable example is a Hotel search on Google. By changing “Book a room” to “Check availability” in a hotel search form, the Google team reached +17% engagement.

- Optimize placement of buttons and links: Place buttons/links where users expect to find them.
- A/B test different designs and messaging.
🚨 New course alert! 🚨
I’m designing a course on Measuring Design — techniques, strategies and tools that will help you quantify design impact. 🎨📊
Help me shape it by filling out this quick survey! 📝👇
https://maven.com/forms/a2e577
User Engagement Metrics: Essentials was originally published in UX Planet on Medium, where people are continuing the conversation by highlighting and responding to this story.