UX Case Study: How We Slashed Enterprise Procurement Time from 6 Weeks to 48 Hours.

Context & Problem Statement
Market Gap: Enterprises waste 40% of IT budgets on mismatched solutions due to fragmented procurement processes (Gartner, 2024). Users face decision fatigue when navigating siloed service catalogs and lack the tools to align technical specs with financial constraints.
Core Challenges:
- Reduce time-to-solution from 6 weeks to <48 hours.
- Balance automation (pre-packaged solutions) with customization (bespoke architectures).
- Ensure seamless handoff from procurement to deployment (Define → Design → Deliver).
Insights from PRD Document:
After continuous workshop sessions with the product team, here are the top insights that were gathered from the PRD document. Please note, that many of the research activities like user interviews were conducted by the product team before the start.
Product Vision: Enable seamless discovery, customization, and procurement of technical solutions via an intuitive chat interface.
User Personas
Primary:
Technical Decision-Maker (e.g., CTO, DevOps Lead)
- Goals: Rapidly identify scalable solutions, control costs, and avoid vendor lock-in.
- Pain Points: Overwhelmed by fragmented service catalogs, and lack of budget transparency.
- Key Behaviors: Prefers self-service tools, and values architectural flexibility.
Secondary:
Business Stakeholder (e.g., Product Manager)
- Goals: Align solutions with business KPIs, and accelerate time-to-market.
- Pain Points: Difficulty translating technical specs to business outcomes.
- Key Behaviors: Relies on pre-vetted options, and prioritizes ease of integration.
Constraints
- Integration with 100+ legacy service catalogs.
- Real-time cost modeling for hybrid architectures (cloud + on-prem).
Research & Insights
Please note, that many of the research activities like user interviews were conducted by the product team before the start. Hence design team focused on the competition for inspiration and insight gathering. Here’s what we found!
Competitive Analysis:
- Finding: Top tools (e.g., ServiceNow, CloudHealth) offered static catalogs but lacked AI-driven scope analysis. Users manually cross-referenced 3+ tools for cost modeling.
- Insight: Opportunity to differentiate via contextual chat and dynamic architecture mapping
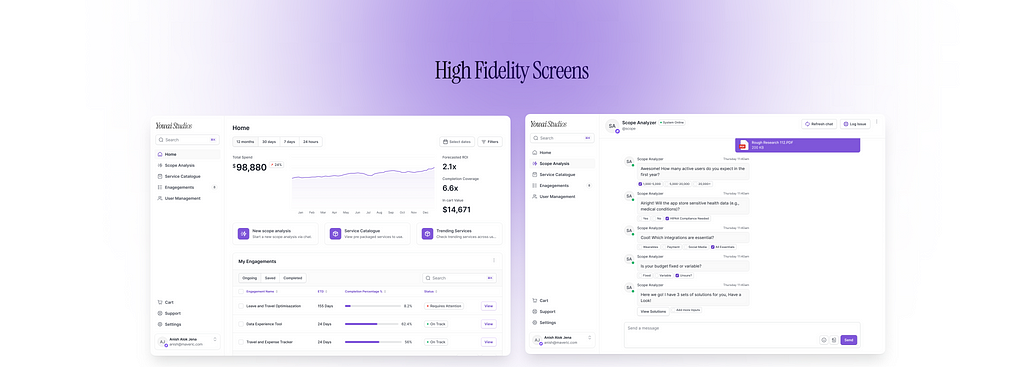
Proposed Solution (User stories & High-Fidelity Designs)
While wireframes are a commonly used tool in the design process, it’s important to note that they are not always the best starting point for every project. It is harder to gather feedback from stakeholders who may need a more polished representation of the final product. In this case, beginning with higher-fidelity designs using the design system is more effective.
I will link the Figma file if anyone wishes to view the Initial brainstorm, wireframes, what were high-fidelity screens, iterations, and prototype.
File Link: https://www.figma.com/design/9TO5GGmaJw9NTSHvdszWp0/Scope-Analyzer?node-id=0-1&t=frdj9rnauyqBUwfY-1


Key Design Decisions
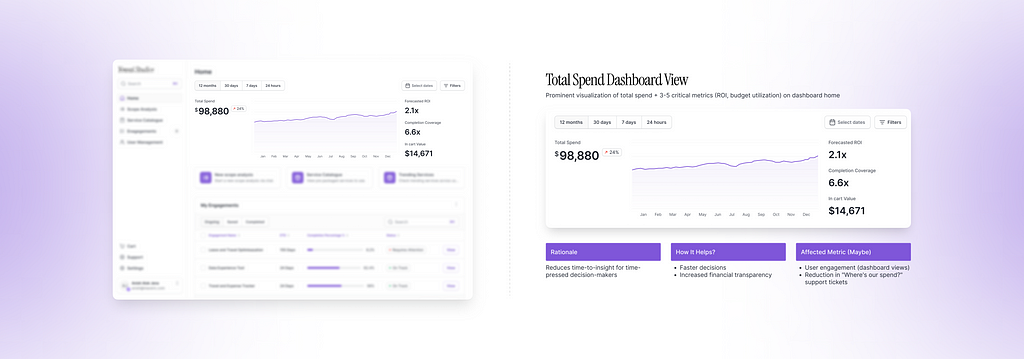
1. Total Spend Dashboard view
Executives need to see their tech investments at a glance, like checking a bank balance. Our dashboard prioritizes financial clarity, reducing sudden astonishment.
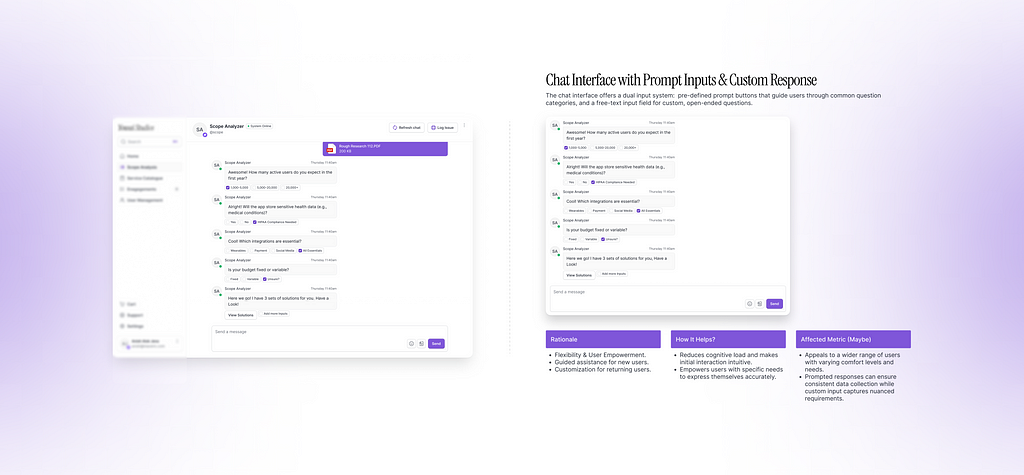
2. Chat Interface with Prompt Inputs & Custom Response
Chat interface is flexible and user-friendly. Prompts offer structured guidance for common queries, accelerating the scoping process for typical use cases. However, recognizing that not all needs fit neatly into categories, the free-text input ensures users can express unique or complex requirements. This hybrid approach balances efficiency for common paths with the freedom for bespoke exploration within the chat interaction.
3. Editable Scope & Solution Refinement
The ‘Editable Scope’ showcase is crucial for iterative solution refinement. Presenting initial options (pre-packaged and bespoke) isn’t the end of the process. Users often need to fine-tune their needs after seeing potential solutions. Allowing them to directly edit their input and immediately refine the results helps a efficient and interactive experience. This iterative loop empowers users to explore different scenarios, understand the sensitivity of solutions to scope changes, and ultimately arrive at the best-matched option. It acknowledges that scope definition is often an evolving process, not a static starting point.

4. Option Match Percentage & Reasons
Presenting a ‘Match Percentage’ alongside each solution option provides immediate, quantifiable relevance to the user’s defined scope. Crucially, displaying the ‘Reasons’ behind this percentage goes beyond a simple score. It offers transparent justification, explaining why a particular option is considered a good match, highlighting specific features or service components that align with user inputs. This transparency builds trust and credibility, moving beyond a ‘black box’ recommendation system. It empowers users to critically evaluate the recommendations and understand the platform’s logic, helping confidence in its judgment.

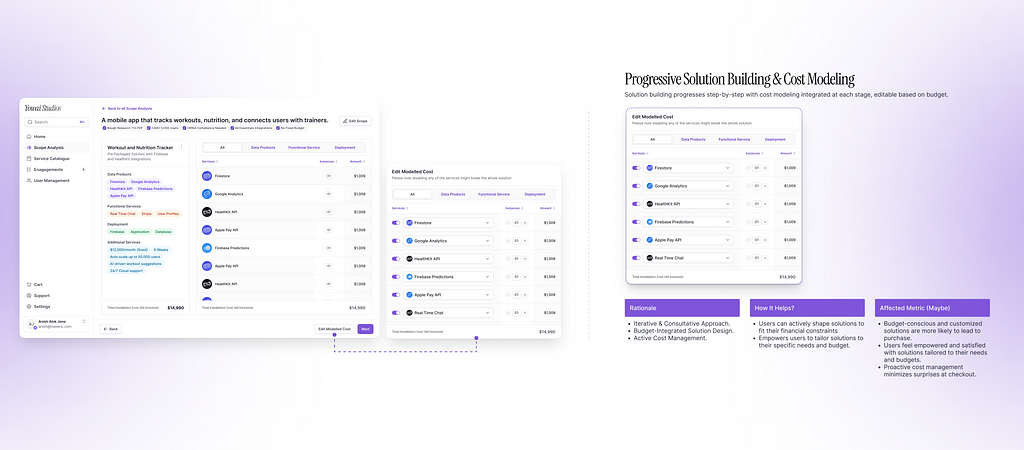
5. Progressive Solution Building & Cost Modeling
‘Progressive Solution Building’ with integrated cost modeling is designed to mimic a consultative sales process. Instead of presenting a final, rigid solution, the platform guides users through a step-by-step construction, allowing them to incrementally build their solution. Crucially, cost modeling is interwoven into each step, providing immediate financial feedback as users add or adjust components. This iterative approach empowers users to actively manage costs, experiment with different configurations within their budget, and create a solution that is both functionally effective and financially viable. It shifts the paradigm from a passive selection process to an active, budget-aware construction.
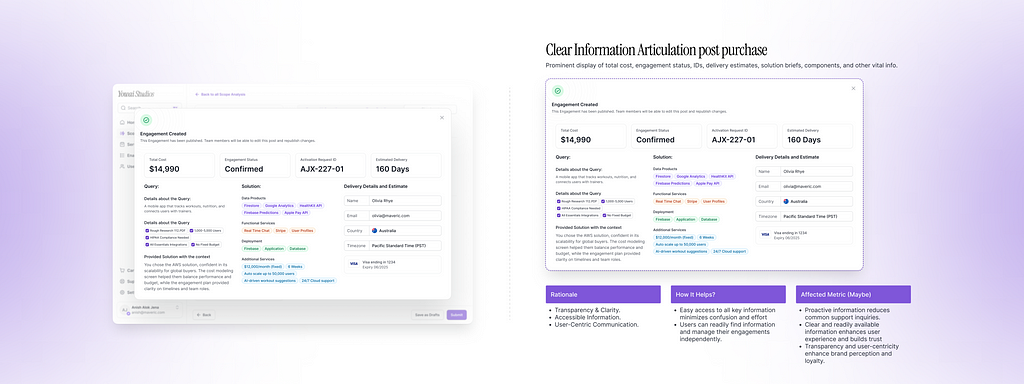
6. Clear Information Articulation post purchase
‘Clear Information Articulation’ is about prioritizing transparency and user clarity at every stage. Prominently displaying key details like total cost, engagement status, IDs, delivery estimates, solution briefs, and component breakdowns directly addresses user needs for clear and accessible information after purchase. This eliminates ambiguity and reduces the need for users to search for crucial details. This commitment to clarity is essential for building a user-friendly and reliable platform.
Top Learnings:
- Users hate feeling trapped by AI decisions. Let them tweak even small parts of a solution, else they’ll distrust the whole system.
- What looks “simple” (e.g., chat interface) takes 10x more work than fancy dashboards. This has to be intuitive or else user it can become complex the moment users don’t understand any prompt to pick from .
- Non-tech users (Secondary persona) care about cost first, tech specs second. Always link architecture choices to amount associated.
Some Challenges:
- Legacy systems are messy. A user’s “AWS setup” could mean 5 outdated services. Hence designs have to deal with multiple unclean setups.
- Translating “enterprise needs” into clickable options without being intuitive could have led to users not using the tool to purchase but just to use as a comparative method of solutioning.
- Sales teams will push for upsells that ruin the UX.
What went wrong?
- Users skip the chat and jump to solutions to “save time,” then blame you for mismatched results.
- The “% match” score becomes double edged sword. Teams ignore better options because “the AI said 75%.”
- Cost modeling feels like a game. Users try to “hack” prices by toggling services wildly, creating unusable architectures.
- You accidentally train users to expect discounts. (“If I remove 24×7 monitoring, will it drop below $10K?”)
Conclusion
This project wasn’t just about designing a tool — it was about fundamentally rethinking how enterprises approach procurement. By replacing static forms and fragmented workflows with an AI-driven, conversational interface, we reduced the average procurement time from 6 weeks to just 48 hours.
The key was balancing automation with user having control:
- The chat interface guided users without overwhelming them.
- The scope editor and cost modeling tools empowered teams to refine solutions in real time.
- Transparency features like match percentages and forecast KPIs built trust and drove faster decision-making.
The result? A platform that doesn’t just save time but also helps users make smarter, more confident decisions. By aligning technical solutions with business goals, we turned procurement from a frustrating chore into a collaborative, data-driven process.
Did you know?
You can give up to 50 Claps for this article. Try holding the button *wink*
Hit me up on Social Media

![]()
UX Case Study: How We Slashed Enterprise Procurement Time from 6 Weeks to 48 Hours was originally published in UX Planet on Medium, where people are continuing the conversation by highlighting and responding to this story.