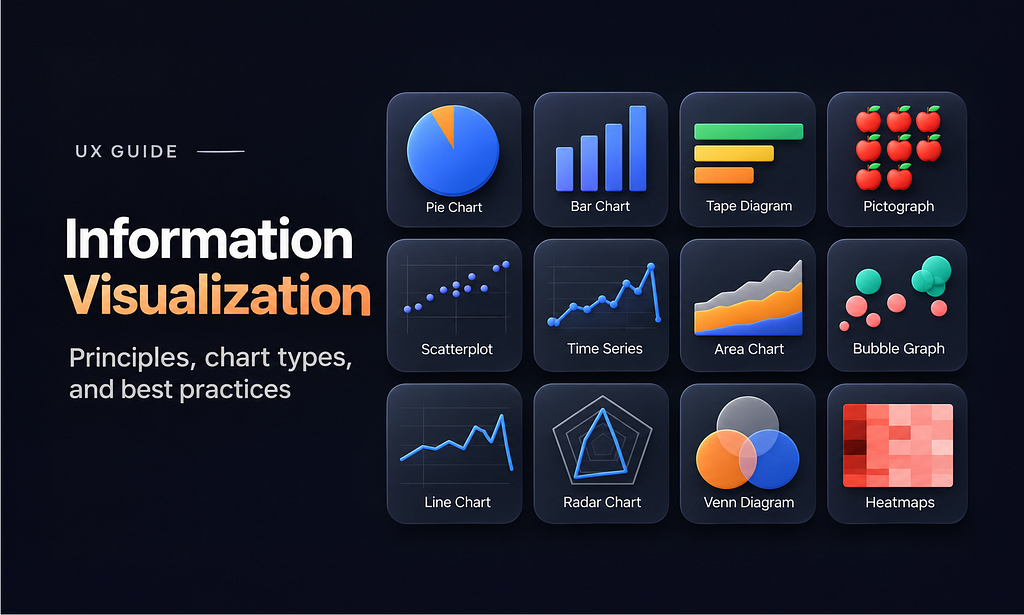
How to turn complex data into clear, meaningful, and actionable visualizations
We live in a world where organizations collect enormous amounts of data. But collecting data and understanding it are two very different things. And this problem becomes even more noticable in the context of dashboards that org create: a dashboard might contain dozens of charts and hundreds of data points, yet still fail to answer the fundamental question:
What should I do with this information?
And, unfortunately, with the rise of AI tools this problem becomes more and more important because data visualization design now is easier than ever, but not many people who create dashboards understand the principles behind good visualization.
Information visualization is a discipline that aims to answer this question. In this article, I’ll explain what information visualization is and share 6 practical rules for creating effective information visualizations.
What is information visualization?
Information visualization is transforming complex data into visual representations that help people understand patterns, identify problems, and make better decisions.
1. Start with the question, not the chart
One of the most common mistakes designers make is focusing too much on visual appearance of data vis and forgetting functional purpose that it serves. As a result, they focus too much on selecting a chart type before understanding what users actually need to know.
For example, imagine you’re designing a sales dashboard. You have revenue data for the last 12 months. You could show it as a bar chart, a line chart, or a table. But the right choice depends on the question:
- How much revenue did we generate? Show a prominent number.
- How has revenue changed over time? Use a line chart.
- Which product generates the most revenue? Use a ranked bar chart.
- Why is revenue declining? Show contributing factors such as cancellations, returns, or lower conversion rates.
Thats why the first rule is so simple:
Define the decision your visualization should support before choosing how to represent the data.
2. Design for human perception
Good information visualization is based on how the human brain processes visual information. Our brain can quickly recognize differences in position, length, size, and color. Designers can use these properties to help people identify important information without consciously examining every data point.
For example, imagine a dashboard with 20 indicators. If every indicator has the same visual weight, users need to examine each one to find what’s important. But if the two most critical metrics are larger and visually prominent, users can immediately focus on them.
You can also apply Gestalt principles, such as proximity and similarity, to group related information.
Use visual hierarchy, grouping, and contrast to direct attention toward information that matters.
3. Choose the right visual representation
Not all charts are equally effective at communicating a particular type of information:
- A pie chart can communicate simple proportions, but it becomes difficult to interpret when it contains too many segments.
- A bar chart is usually more effective when users need to compare values across categories.
- A line chart works well for showing changes over time.
- And a network diagram helps visualize relationships between connected entities.
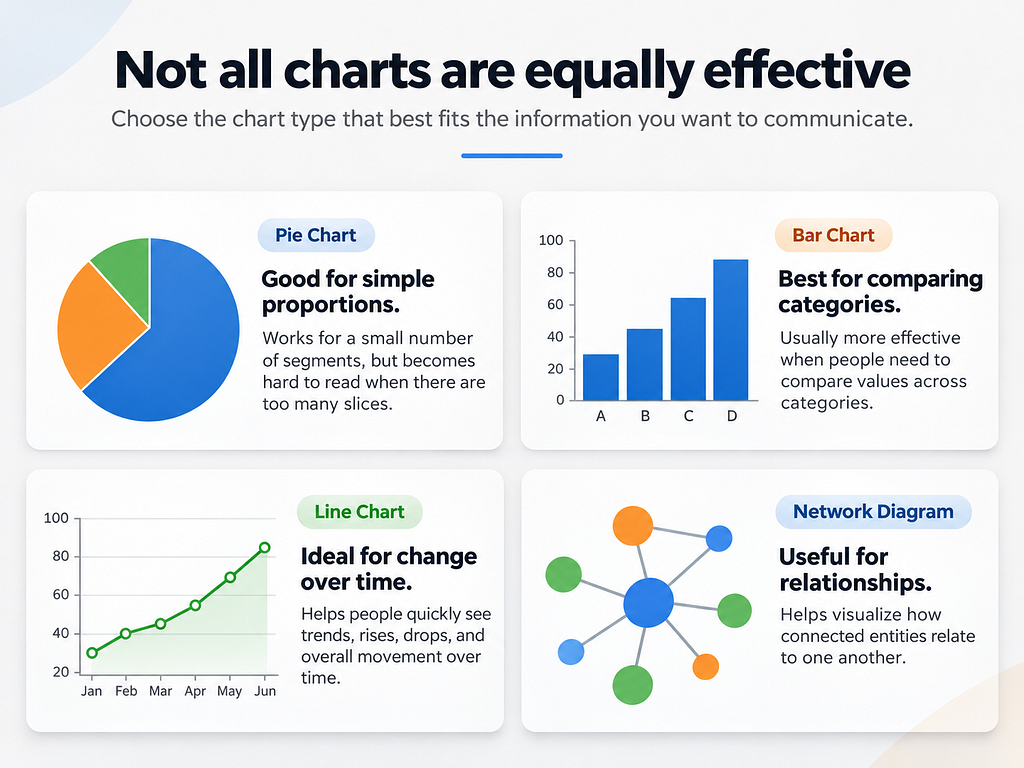
You need to match the visualization to the structure of the data and the task users need to perform.
Choose charts based on what insights users need to extract from data, not on which visualization looks most impressive.
4. Reduce information overload
One of the biggest problems with modern systems (including dashboards) is that designers try to display everything at once. But more data doesn’t necessarily produce better insights.
The signals often result in complete for human attention.
A better approach is to information priorization and, if you need to provide more information, use progressive disclosure (aka offer additional details on demand).
The approach I follow is simple:
- Start by presenting the most important information up front.
- Then allow users to explore additional details when necessary.
For example, a revenue dashboard might initially display three key metrics: Total revenue, Net profit and Revenue growth. Give users an option to drill down into specific regions, products, or time periods.
Another important consideration is removing chartjunk (decorative visual elements that don’t improve understanding).
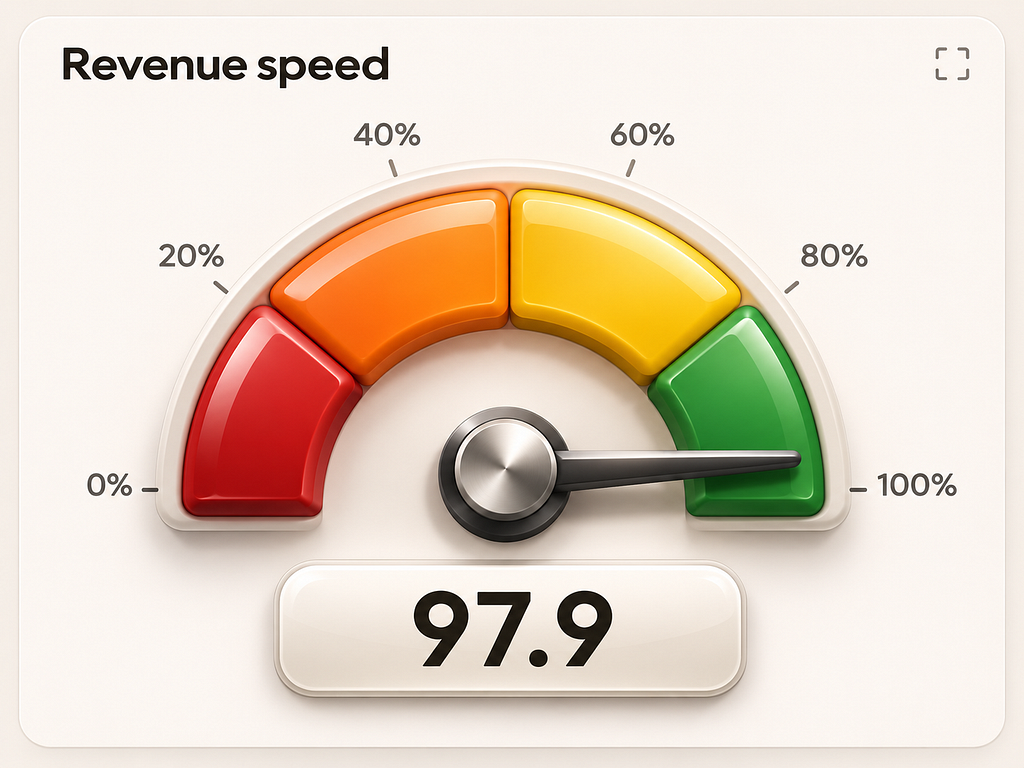
Unnecessary 3D effects, heavy gradients, excessive gridlines, and decorative illustrations can make visualizations harder to read.
Every visual element should contribute to understanding the data. If it doesn’t, consider removing it.
5. Make visualizations interactive when necessary
Static charts are useful when everyone needs to see the same information. But when users have different questions or need to investigate complex data, interaction becomes valuable.
For example, an interactive sales dashboard might allow users to:
- Filter revenue by product category.
- Compare performance across different periods.
- Drill down into individual transactions.
- Explore relationships between multiple metrics.
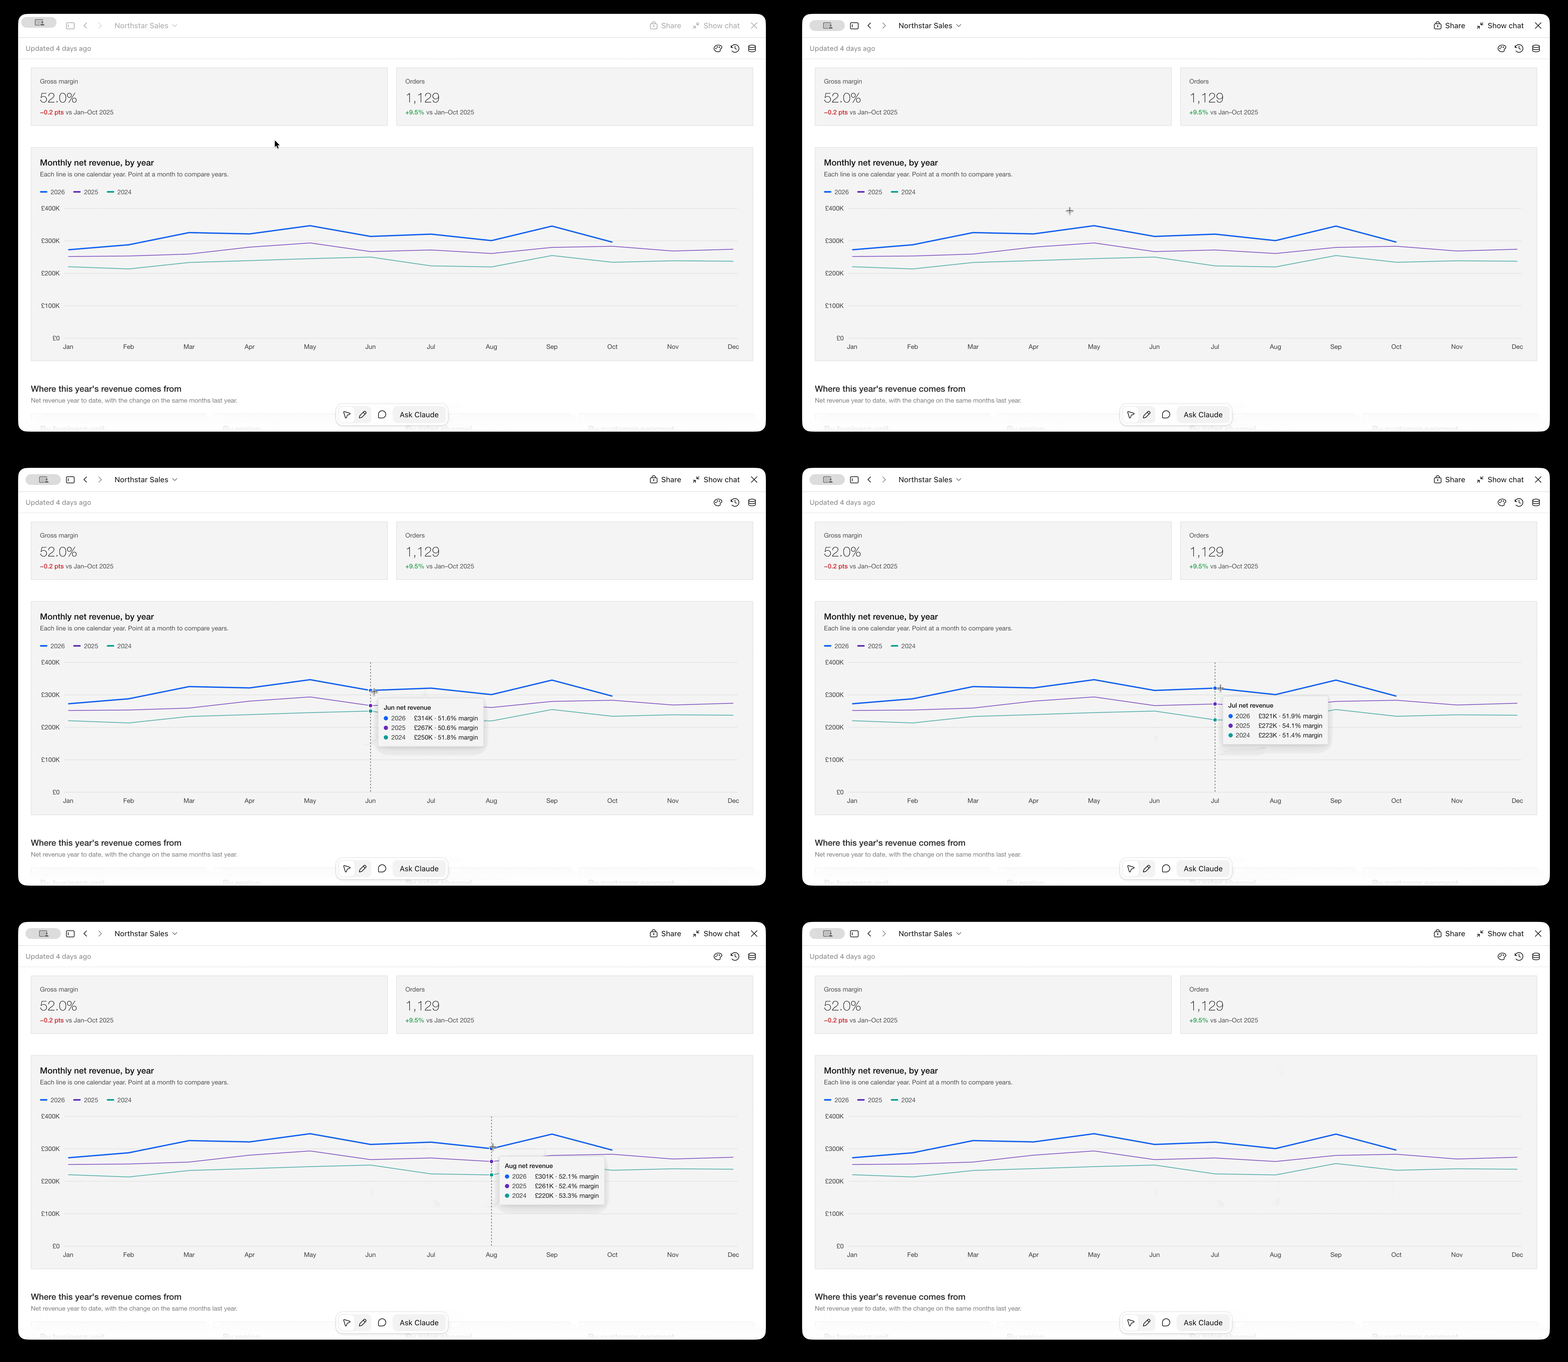
But similar to any design decision, interaction should always serve a clear purpose. If you add dozens of filters and controls assuming users will need, can easily create more complexity than value.
Introduce interaction when it helps users answer questions that a static visualization cannot.
6. Evaluate whether your visualization actually works
You are not your user ©
A visualization that looks perfectly clear to you (its creator) can be confusing to everyone else. That’s why evaluation is an essential part of the design process.
You don’t necessarily need a large usability study to identify problems.
Start by showing your visualization to a few people (2–3 people who represent your target audience)
Ask them questions such as:
- What is the most important information on this screen?
- What conclusions can you draw from this chart?
- Can you identify any unusual trends?
- What action would you take based on this information?
Pay attention to whether users interpret the visualization correctly, how quickly they find answers, and where they struggle.
Don’t evaluate visualizations solely; evaluate how effectively it works for your target audience
Want to master information visualization?
If you want to go beyond the basics, I recommend exploring the Information Visualization course by the Interaction Design Foundation (IxDF). The course covers human visual perception and memory, Gestalt principles, visual mapping, advanced techniques for representing complex data, and methods for evaluating visualizations.
Information Visualization Course

Information Visualization: 6 Essential Rules Every Designer Should Know was originally published in UX Planet on Medium, where people are continuing the conversation by highlighting and responding to this story.