Measuring design outcomes is a vital exercise that every product team should practice. I’m starting a series of posts about measuring product design, and in the first post, I want to propose a set of core metrics that work for almost any organization. Metrics are structured into two buckets — outcome and organizational levels.
Outcome Level
Measures the impact on the customer and business outcome. This level is evident since we all want to design user-centered products that align with business goals.
User experience:
Measure how UX research impacts the user experience.
Metrics:
- Task success rate. Task success rate measures how effectively an individual user completes tasks. It is often expressed as a percentage and calculated by dividing the number of successful task completions by the total number of tasks attempted. For example, if 80 out of 100 tasks are completed successfully, task success rate will be 80%.

- User engagement (like time spent on a page). Its a key metric in understanding how effectively a page captures and holds the attention of its visitors. You can use tools like Google Analytics to track the average session duration and time on specific pages.

- User satisfaction score (CSAT). This metric is used to measure how satisfied users are with a product, service, or experience. CSAT is typically measured through surveys where users are asked to rate their satisfaction on a scale (e.g., 1–5, 1–10, or using labels like “Very Unsatisfied” to “Very Satisfied”).

Business
Determine how UX research influences business performance (impact on business bottom line).
Metrics:
- Retention (i.e., returning customers). Its a vital metric for evaluating customer loyalty and the long-term success of a business. It reflects how well a company maintains relationships with its customers.

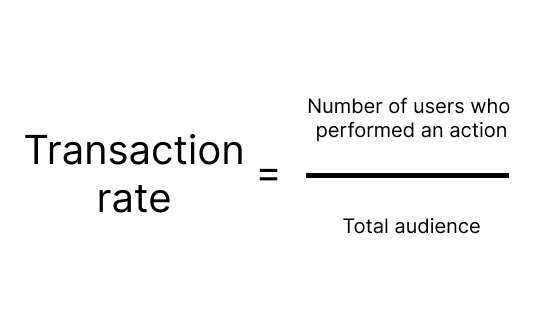
- Transaction rate. Measures the percentage of users or customers who complete a transaction (e.g., purchase, booking, or subscription) relative to the total number of users. It’s a crucial indicator of how effectively a website, app, or business converts visitors into paying customers.
Organizational Level
Direct impact product design, and UX research in particular, makes on organizational culture. Ideally, research should be baked into the heart of org culture, driving innovation and constant improvement.
Organizational learning
Evaluate how UX research is influencing strategy and product decisions.
Metrics:
- Number of product changes based on research insights. How many updates, features, or modifications were implemented in a product based on data-driven research or user feedback. This metric is critical for evaluating how effectively a company integrates research insights into its development processes.
- Frequency of referencing research data. How often research insights are used during decision-making processes in product development, marketing, customer support, or other business areas. This metric reflects how integrated data-driven decision-making is within an organization.
Engagement
Measure the involvement of different roles within the organization in the research process.
Metrics:
- Number of research requests. Measures how frequently teams, departments, or stakeholders request research to support their decision-making or project development. This metric reflects the organization’s reliance on research and its integration into workflows.
- Stakeholder satisfaction rate. Stakeholder Satisfaction Rate is a metric that measures how satisfied stakeholders (e.g., customers, employees, investors, or other key parties) are with a project, product, or organization.
🚨 New course alert! 🚨
I’m designing a course on Measuring Design — techniques, strategies and tools that will help you quantify design impact. 🎨📊
Help me shape it by filling out this quick survey! 📝👇
https://maven.com/forms/a2e577
![]()
Measuring Design: Essential Metrics was originally published in UX Planet on Medium, where people are continuing the conversation by highlighting and responding to this story.